Introduction
Hi friends, in the post we discussed how to get synthetics monitoring to work in new relic, Synthetics monitoring is a powerful tool for monitoring the performance of websites and applications. It can help you identify issues before they become problems, and ensure that your customers have a positive experience when they interact with your business.
With New Relic’s Synthetics monitoring, you can easily set up automated tests to track the performance of your website or application. This guide will shows you how to get started with Synthetics in New Relic so that you can start tracking and improving the performance of your digital services.
What is Synthetic Monitoring?

Synthetic monitoring is a type of website or application monitoring that simulates user interactions to assess the performance, availability, and functionality of a system. It involves creating artificial transactions or requests that mimic real user behaviour and monitoring the system’s response to these synthetic transactions.
The purpose of synthetic monitoring is to proactively identify & address potential problems before they impact real users. By simulating user interactions, organizations can gain insights into how their applications or websites perform under different conditions, such as varying network speeds or geographical locations.
Here are some key aspects of synthetic monitoring:
Simulation of User Interactions
Synthetic monitoring involves creating scripted scenarios that simulate user actions like visiting specific pages, submitting forms, clicking buttons, or navigating through workflows. These scripts are executed at regular intervals to monitor the system’s response.
Performance and Availability Monitoring
Synthetic monitoring helps measure the response time of transactions, allowing organizations to assess the performance and availability of their systems. It can detect issues like slow page load times, server errors, or service disruptions.
Geographical and Network Testing
Synthetic monitoring can be performed from multiple monitoring locations, providing insights into how the system behaves in different regions or under varying network conditions. This helps identify regional performance variations and potential latency issues.
Error Detection and Alerting
Synthetic monitors can detect errors or failures during the simulated transactions, such as encountering HTTP errors or receiving unexpected responses. Organizations can set up alerts to be notified when such errors occur, enabling them to investigate and resolve issues promptly.
Load Testing and Capacity Planning
Synthetic monitoring can also be used for load testing purposes, where simulated transactions are performed at higher volumes to assess the system’s scalability and performance under heavy loads. This information helps in capacity planning and ensuring the system can handle anticipated user traffic.
Synthetic monitoring provides a proactive approach to identifying and resolving potential issues, optimizing performance, and ensuring a positive user experience. By simulating user interactions, organizations can gain valuable insights into their systems’ behaviours and make informed decisions to improve their applications or websites.
What is Synthetic Monitoring in New Relic?

Synthetic monitoring in New Relic is a feature that allows you to simulate user interactions with your applications or websites from different locations around the world. It helps you monitor the availability, functionality, and performance of your applications from an external perspective.
Rather than relying solely on real user traffic, synthetic monitoring creates artificial transactions or requests that mimic user behaviour. These synthetic transactions are executed at regular intervals from New Relic’s global monitoring locations, providing you with a consistent and proactive monitoring solution.
Here are some key aspects of synthetic monitoring in New Relic:
Simulating User Interactions
Synthetic monitors in New Relic can configure to perform actions like visiting specific URLs, submitting forms, clicking buttons, or executing custom scripts. These actions design to simulate real user interactions with your application.
Monitoring From Multiple Locations
New Relic offers a global network of monitoring locations, allowing you to test your application’s availability and performance from different geographical regions. This helps identify potential issues related to network latency or regional variations.
Monitoring Critical Transactions
You can configure synthetic monitors to focus on specific critical transactions or workflows within your application. By monitoring these key transactions, you can gain insights into their response times, identify errors, and ensure they are functioning as expected.
Alerting and Notifications
New Relic allows you to set up alert policies based on the results of synthetic monitors. You can define conditions that trigger alerts when specific thresholds are crossed, such as response time exceeding a certain limit or encountering errors. This enables proactive notification of issues before they impact real users.
Reporting and Analysis
New Relic provides comprehensive reporting and analysis capabilities for synthetic monitoring. You can view performance trends, historical data, and detailed reports on response times, availability, and errors. This information helps you identify performance bottlenecks, track improvements, and make data-driven decisions for optimizing your application’s user experience.
Synthetic monitoring complements other monitoring approaches like real user monitoring (RUM) and server monitoring. By simulating user interactions and actively monitoring critical transactions, you can proactively identify and address issues, ensuring a positive user experience for your customers.
How To Get Synthetics Monitoring to Work in New Relic
To set up synthetic monitoring in New Relic, follow these steps:
- Create a New Relic account: If you don’t already have one, sign up for a New Relic account at https://newrelic.com/signup.
- Install the New Relic agent: To enable synthetic monitoring. You need to have the New Relic agent installed on your server or application. Refer to the New Relic documentation for detailed instructions on installing the agent specific to your programming language or infrastructure.
- Access the New Relic UI: Log in to your New Relic account at https://one.newrelic.com.
- Navigate to the Synthetics section: In the New Relic UI, click on the “Synthetics” tab in the top navigation menu. This section is where you manage and configure synthetic monitors.
- Create a new synthetic monitor: Click on the “Create a Monitor” button to set up a new synthetic monitor.
- Choose monitor type: Select the type of monitor you want to create. New Relic offers various monitor types such as HTTP, Ping, Scripted Browser, and API.
- Configure monitor settings: Provide the necessary information for the monitor. Including the URL or endpoint you want to monitor, and the frequency of checks. The locations from which the monitor should run.
- Customize monitor options: Depending on the monitor type, you may have additional options to customize. Such as adding headers, defining assertions, or setting up script-based actions.
- Save the monitor: Once you have configured the monitor settings, save it to activate it.
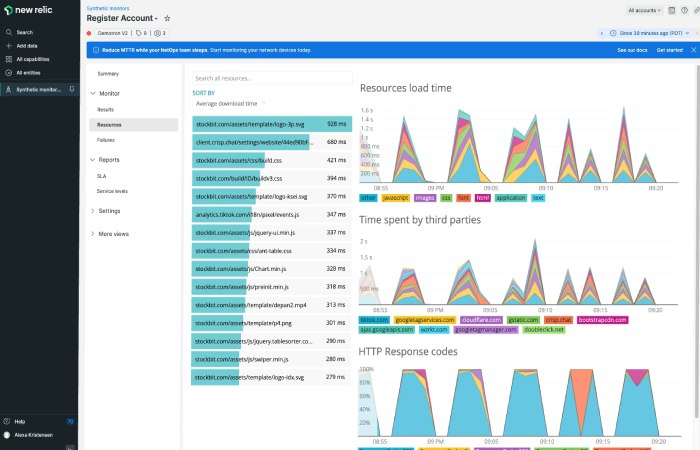
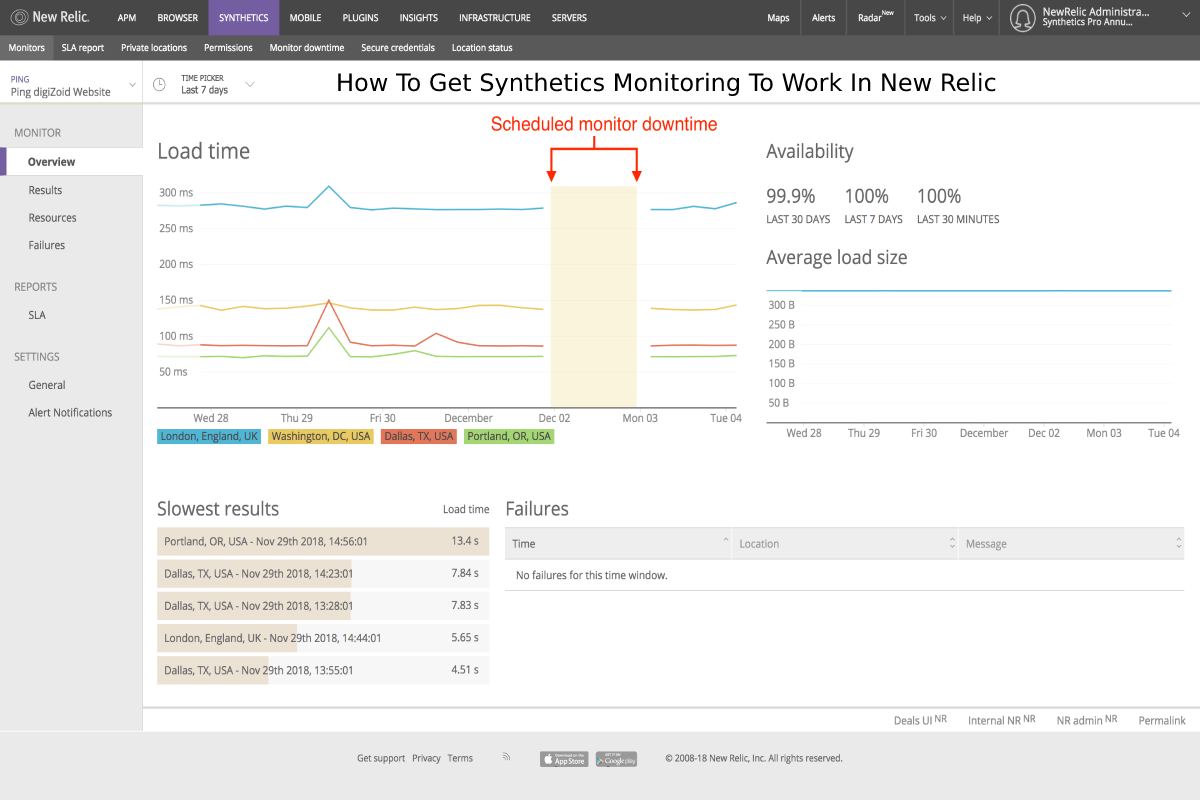
- Monitor results: After the monitor is active. New Relic will start running checks from the specified locations at the defined frequency. You can view the results in the Synthetics section of the New Relic UI.
- Set up alerts: To receive notifications when a monitor fails or meets certain conditions. Set up alert policies in New Relic. This ensures that you are promptly notify of any issues detected by synthetic monitoring.
By following these points, you should be able to set up synthetic monitoring in New Relic and start monitoring. The availability and performance of your applications and infrastructure.
Conclusion
To get the most out of your synthetic monitoring in New Relic. It is important to understand how it works and how to set it up properly. Synthetic monitoring allows you to detect problems before they occur and can help you identify potential issues before they become critical. By following these points, you can ensure that your synthetic monitoring is working as expected and helping you maintain a high level of performance.

